Two numbers came out of the same REALTORS® Association of Edmonton release for August 2026.
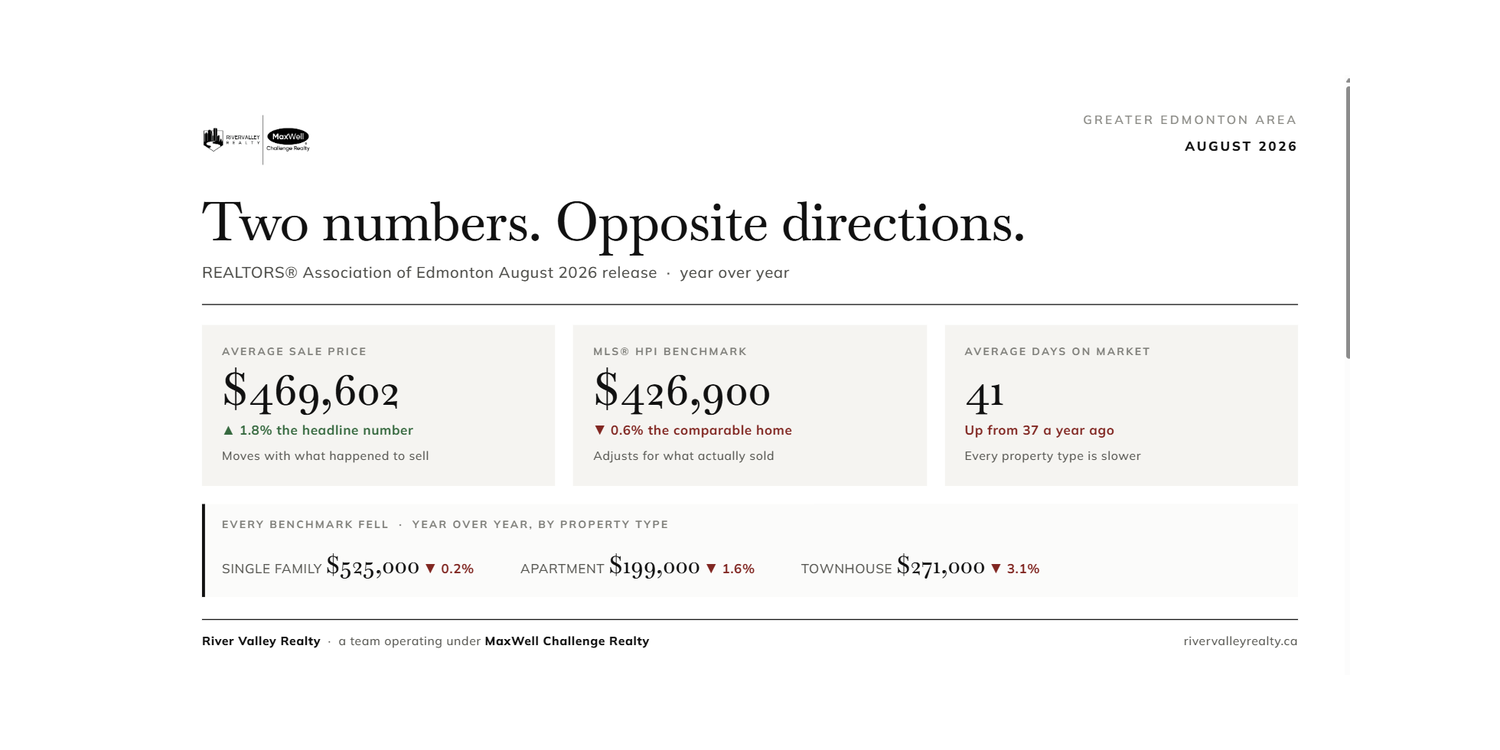
The average selling price across the Greater Edmonton Area was $469,602, up 1.8 per cent from August 2025.
The MLS® Home Price Index benchmark price was $426,900, down 0.6 per cent from August 2025.
Same market. Same month. Same data set. Opposite directions.
If you are thinking about listing this fall, working out which of those two numbers describes your house is the most valuable ten minutes you will spend, because one of them will price your home correctly and the other will leave it sitting.
What the two numbers actually measure
The average price is exactly what it sounds like. Add up every sale and divide by the number of sales. It is simple, it is the number that makes headlines, and it moves for reasons that have nothing to do with property values.
If buyers this August happened to purchase more large detached homes and fewer apartments than they did last August, the average climbs. Not one single home became more valuable. The mix of what sold changed, and the average followed it.
The benchmark price is built differently. The MLS® Home Price Index tracks a notional typical home with consistent characteristics, and reports what that same home would sell for now against what it would have sold for before. It is designed specifically to strip out the mix effect.
So when the average rises and the benchmark falls in the same month, the message is reasonably clear. The composition of sales flattered the average. The underlying value of a comparable home did not rise.
The detail that settles the argument
If a single weak segment were dragging the benchmark down, you would expect the other types to hold up. That is not what August showed.
Across the Greater Edmonton Area, every property type's benchmark price fell year over year:
- Single family: $525,000 benchmark, down 0.2 per cent
- Apartment: $199,000 benchmark, down 1.6 per cent
- Townhouse: $271,000 benchmark, down 3.1 per cent
Not one category posted a quality adjusted gain. The headline average was up 1.8 per cent while every type underneath it was flat or down.
Inside the City of Edmonton the spread is wider still. The city benchmark was $408,000, down 1.6 per cent year over year, while the city average sale price was up 1.9 per cent. By type, city apartments were down 2.1 per cent and townhouses down 4.2 per cent on benchmark.
Time on market is telling the same story
Prices are one signal. How long things take is the other, and it moved in one direction in August.
Average days on market across the Greater Edmonton Area was 41 days, against 37 a year earlier. Every single property type was slower than last year:
- Detached: 38 days, up from 36
- Semi detached: 41 days, up from 35
- Row and townhouse: 45 days, up from 33
- Apartment: 48 days, up from 44
Row and townhouse is the one to sit with. Twelve extra days, on a segment whose benchmark also fell 3.1 per cent. Slower and softer at the same time is not a mix effect. That is a real change in conditions.
Supply explains most of it. The region carried 8,052 active listings in August, 15.1 per cent more than a year ago, at 3.8 months of inventory. The City of Edmonton sat at 4.2 months. Sales, meanwhile, were down 9.8 per cent year over year regionally and 13.1 per cent within the city.
The board said it out loud
This is not an interpretation we are imposing on the numbers. Darlene Reid, the 2026 Board Chair of the REALTORS® Association of Edmonton, noted in the release that supply is ample, and that unless demand keeps pace, "we are likely to see downward pressure on prices beyond the usual seasonal patterns."
A board chair flagging downward pressure beyond normal seasonality is worth reading twice. Activity always cools in the autumn. The point being made is that something is happening on top of that.
If you are listing this fall
Three things follow, and they are practical.
Price to the benchmark and to recent solds, not to the headline. "Average price up 1.8 per cent" is true and almost useless for your specific home. If you add a couple of per cent to what your neighbour got last summer, you are pricing into a market where the comparable value is flat to slightly down.
Do not price to active listings. This is a mistake we see constantly. Other people's asking prices tell you what sellers hope for, not what buyers paid. With inventory up 15.1 per cent, there are more hopeful asking prices around than there were a year ago.
Build the extra time into your plan. If the regional average is 41 days and your property type is slower than that, a listing that goes up in late September is realistically a November completion. Price for the market you are actually in rather than discovering it over six weeks of silence and two reductions.
If you are buying this fall
You have more choice than last year and more time to use it. Inventory is up more than 15 per cent, sales are down, and the pressure to decide in a weekend has eased considerably in most segments.
Two cautions. First, benchmark declines of half a per cent to three per cent are not a collapse, and waiting for one is a strategy with a poor track record. Second, these are regional figures. A tight community inside a softening region still behaves like a tight community, and buying there on the assumption that everything is falling will cost you the house.
The number that actually matters is smaller than any of these
Regional averages and regional benchmarks are both too coarse to price a specific home. What matters is the benchmark trend for your property type in your community, the list to sale ratio on the last several comparable sales, and how long those took.
That is a twenty minute job for us and it is the difference between a listing that sells and one that teaches you something expensive.
Reach out to River Valley Realty for a consultation with no obligation attached. If the numbers say your timing is wrong, we will tell you that too.
All figures from the REALTORS® Association of Edmonton August 2026 residential statistics release, published September 2, 2026, covering the Greater Edmonton Area and the City of Edmonton. Benchmark prices are MLS® Home Price Index values. Information is deemed reliable but not guaranteed and should not be relied upon as a substitute for advice on your specific circumstances.
River Valley Realty is a team operating under MaxWell Challenge Realty, serving Edmonton and surrounding communities.
Check out this article next